Reporting
Data That Defines Your Success
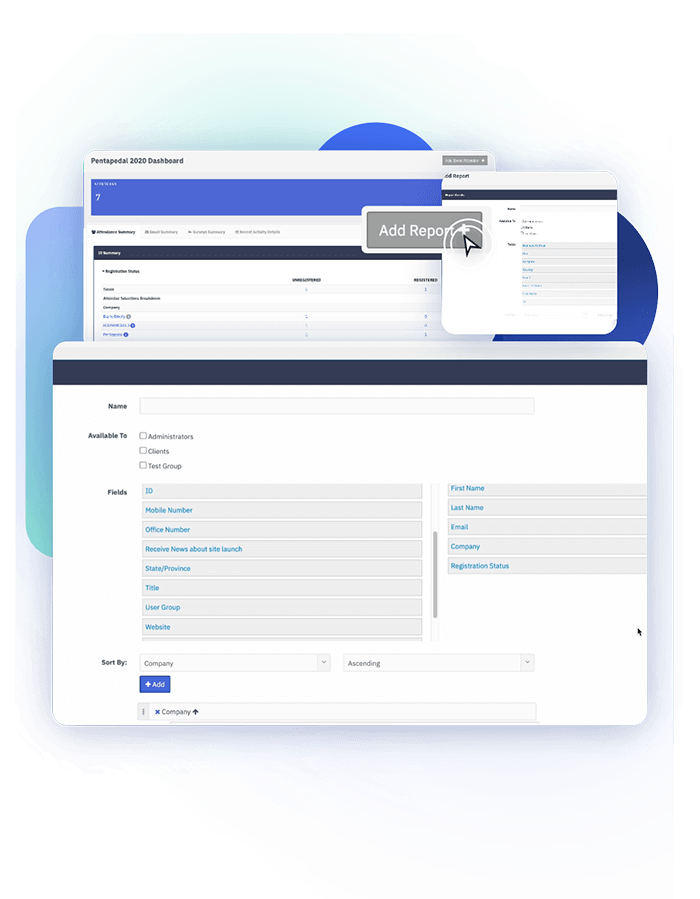
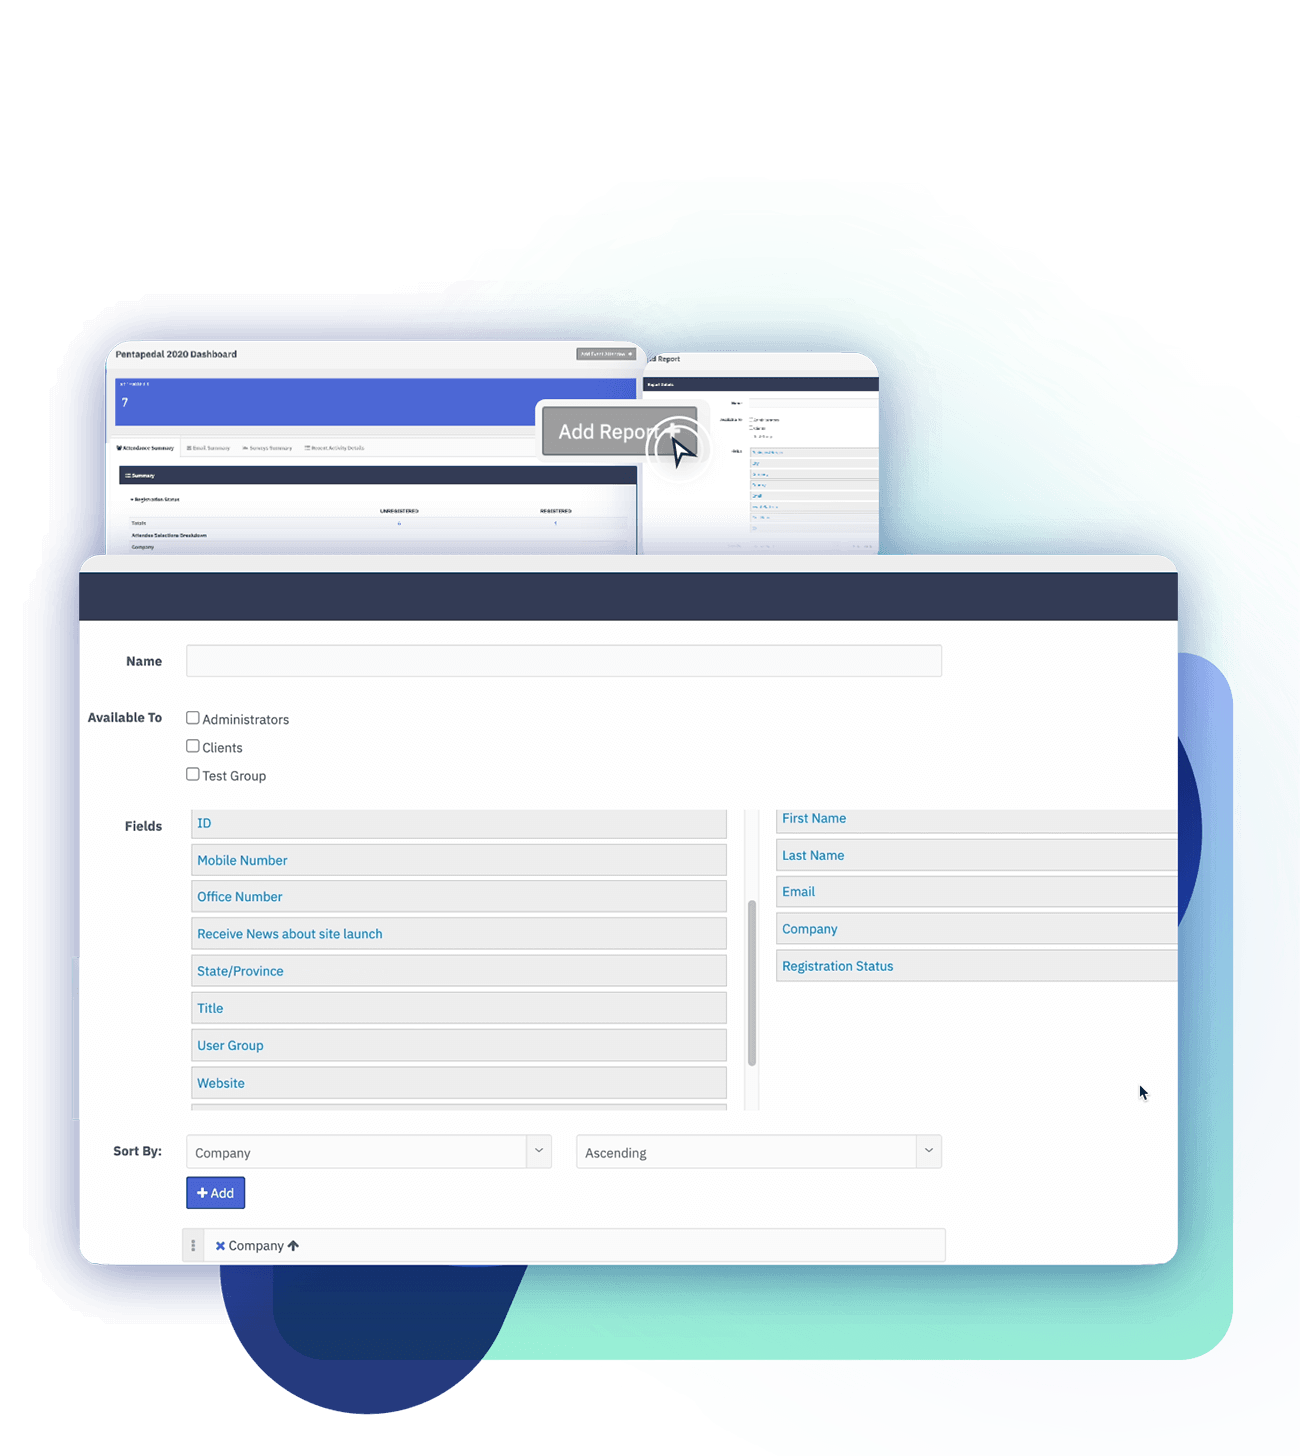
Backend Reporting
Reporting Made Easy
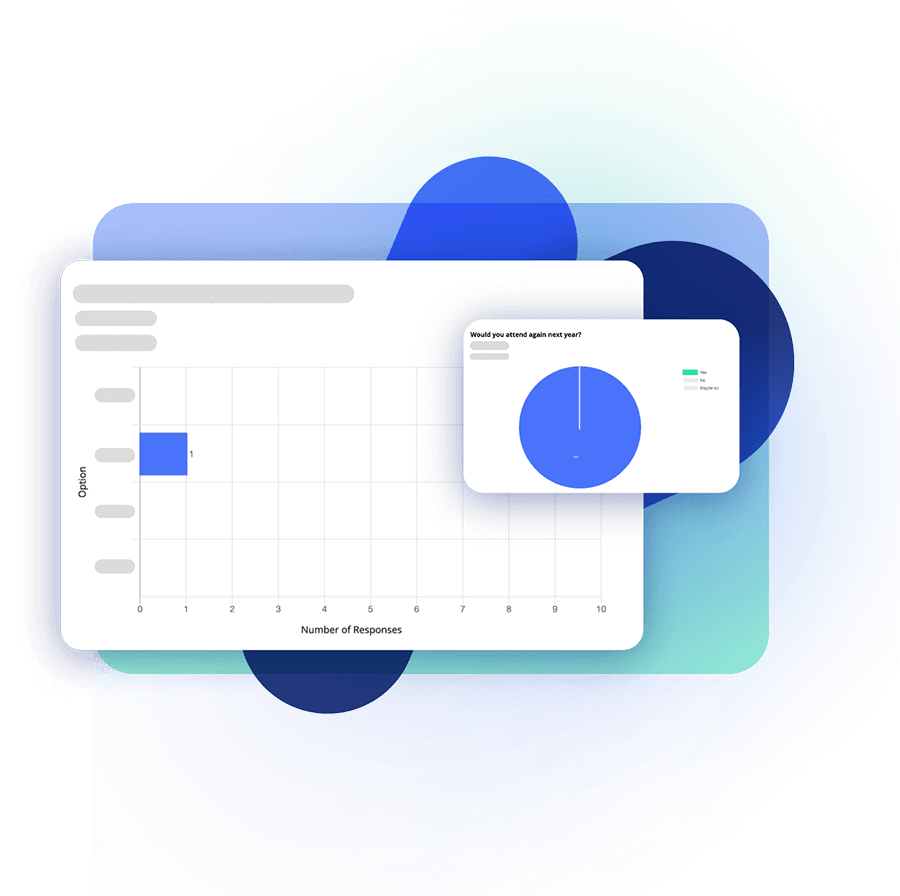
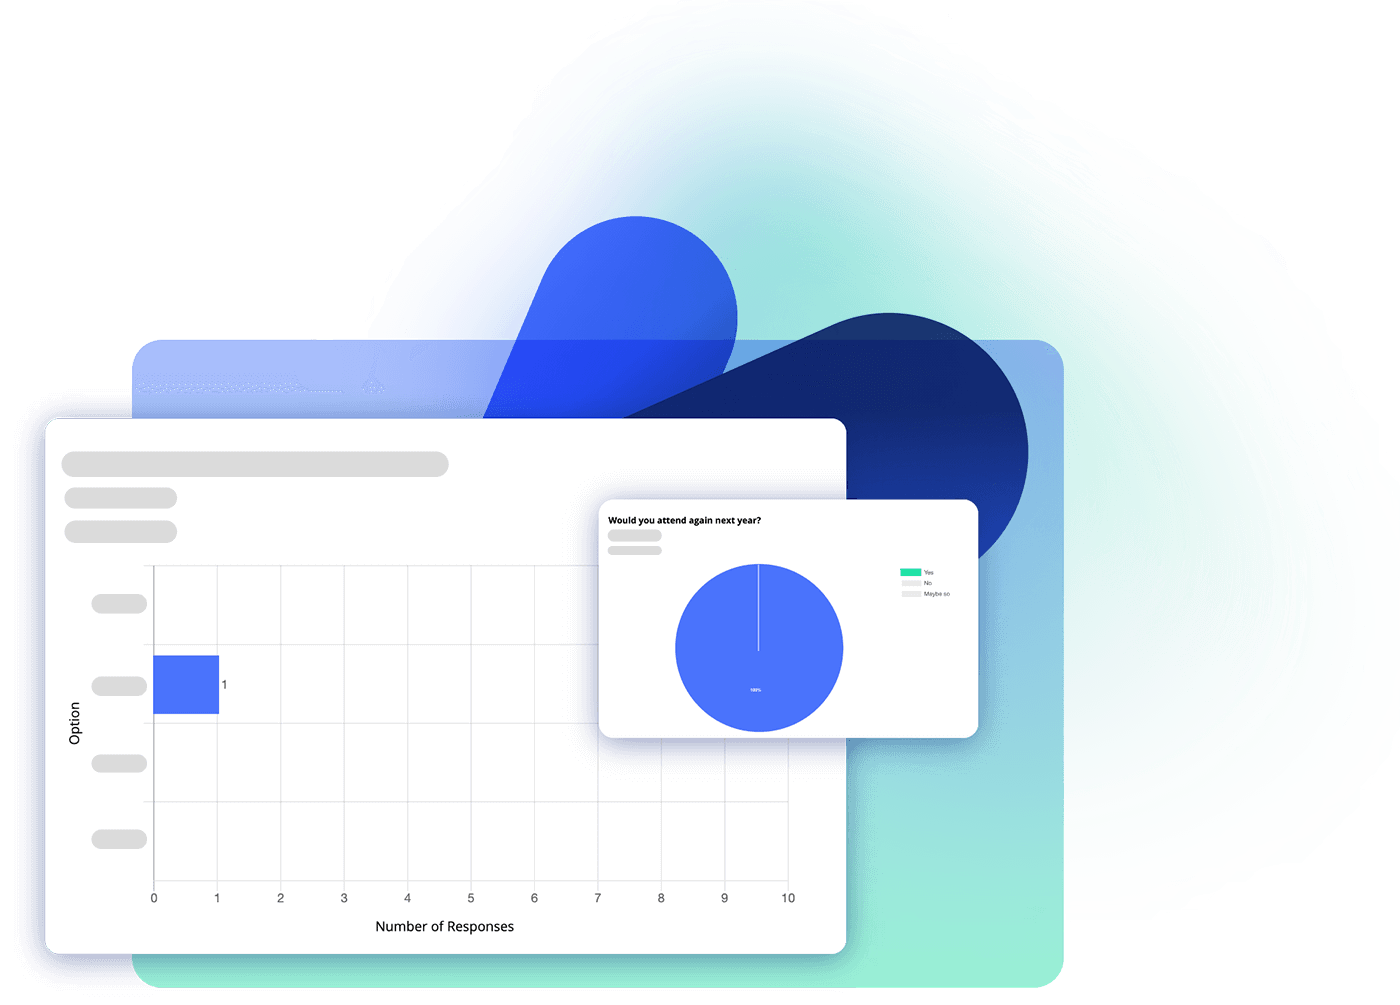
At a Glance Dashboard
Get a rapid review of customized key
metrics for event registrations and
email performance.
Create Customized Reports
Drag and drop the fields you need
for each report.
User-friendly Reports
Download, manipulate, and share
with your partners.
At a Glance Dashboard
Pull a report once, see it update
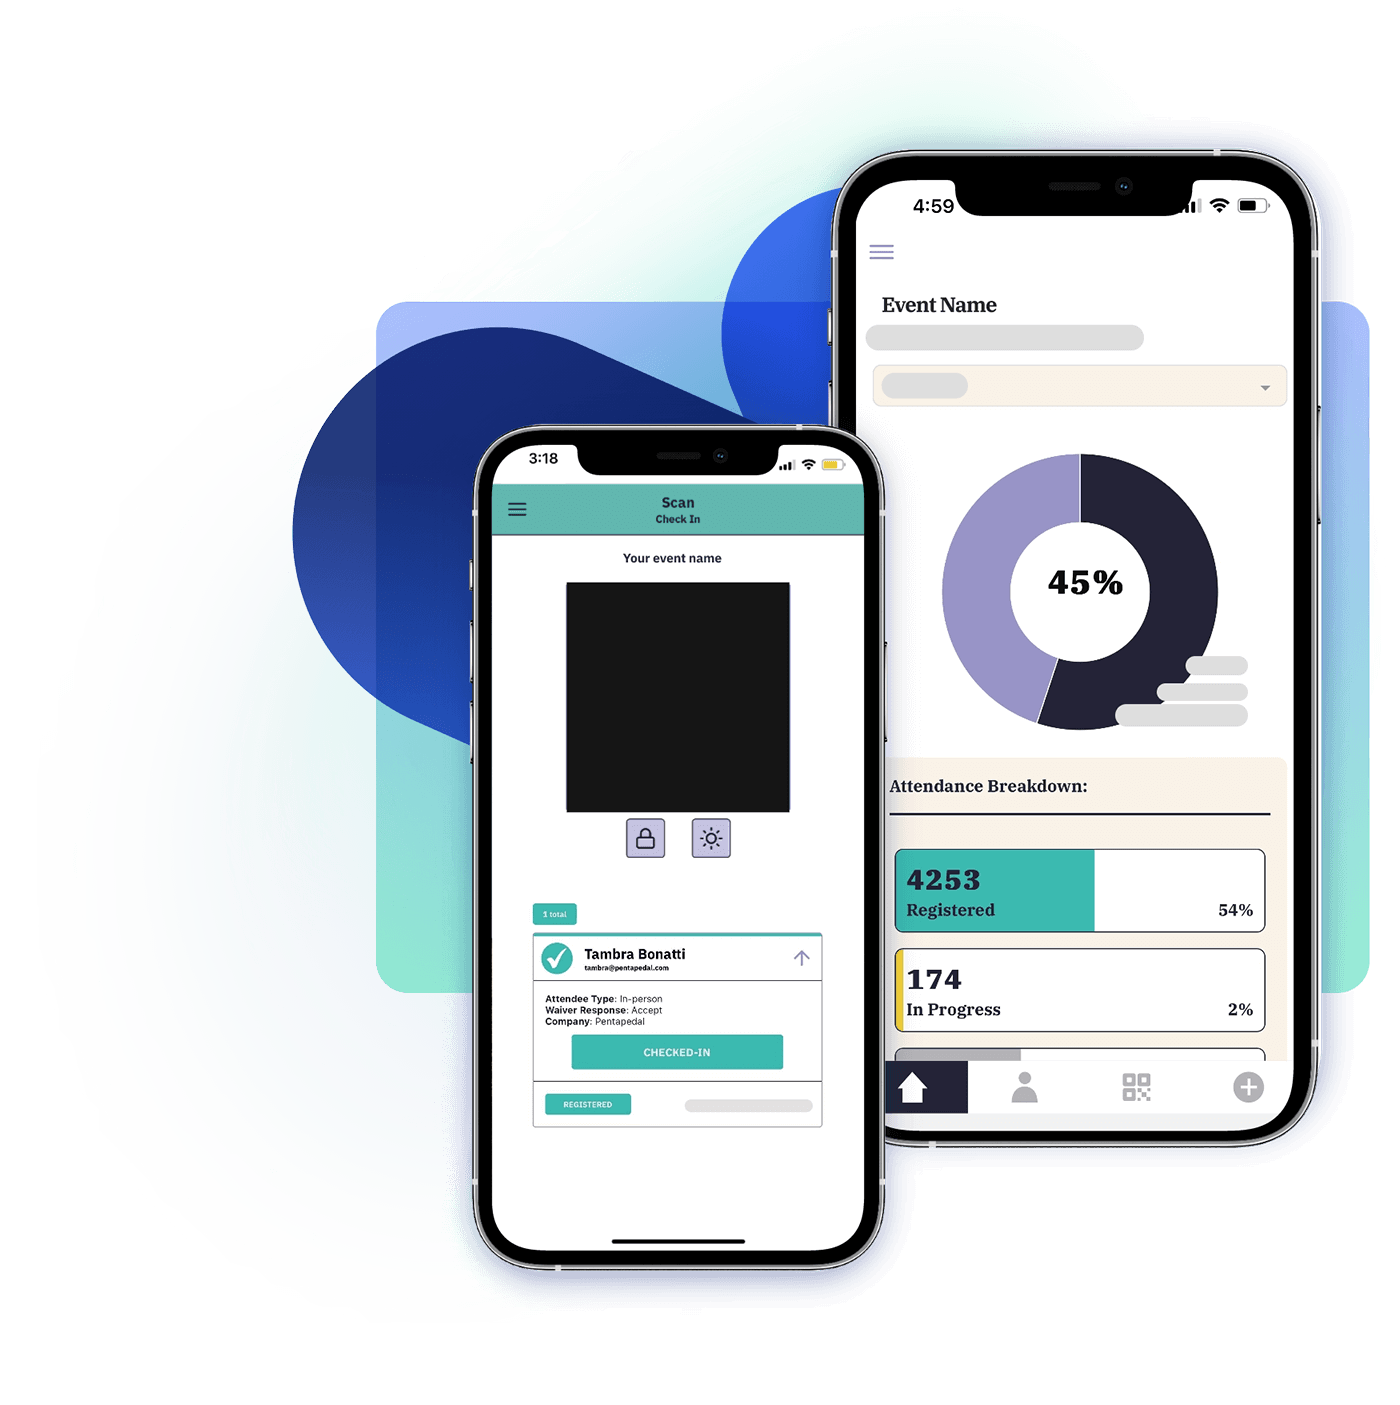
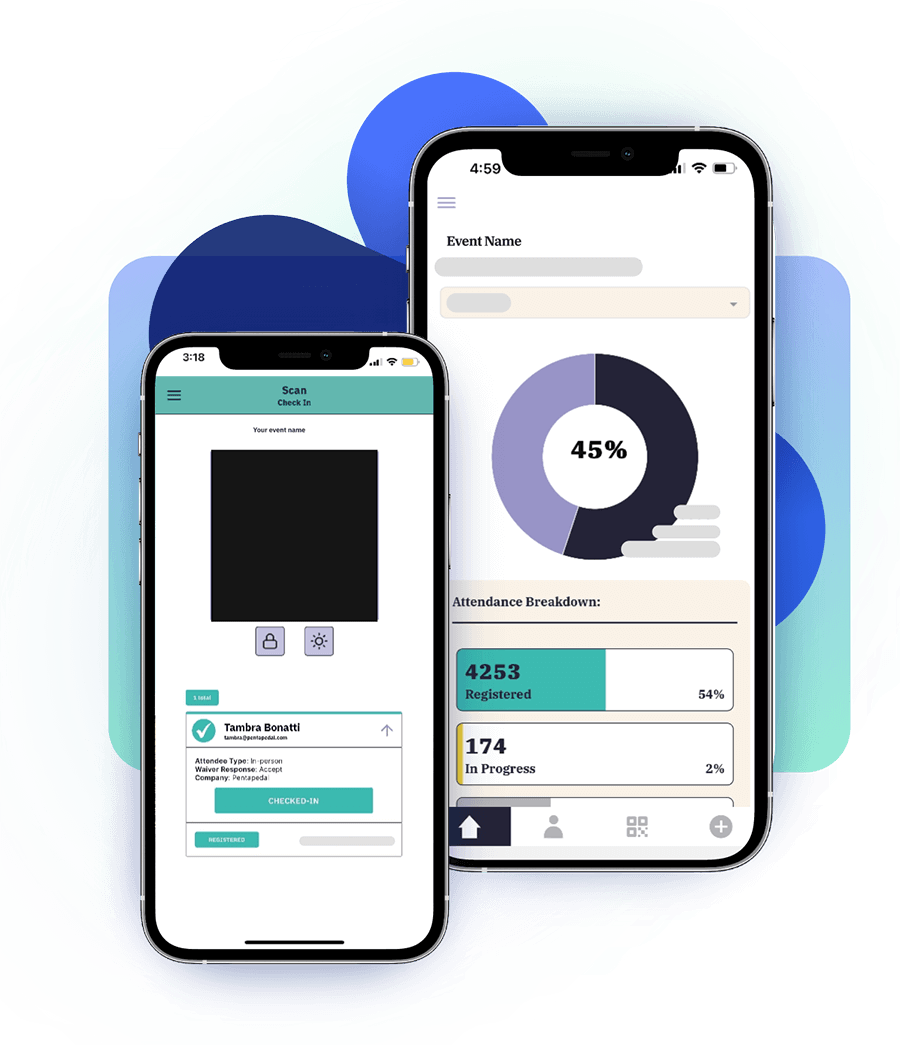
On-site Metrics
Boomerang & Checkmate
Unlock the value of your investment
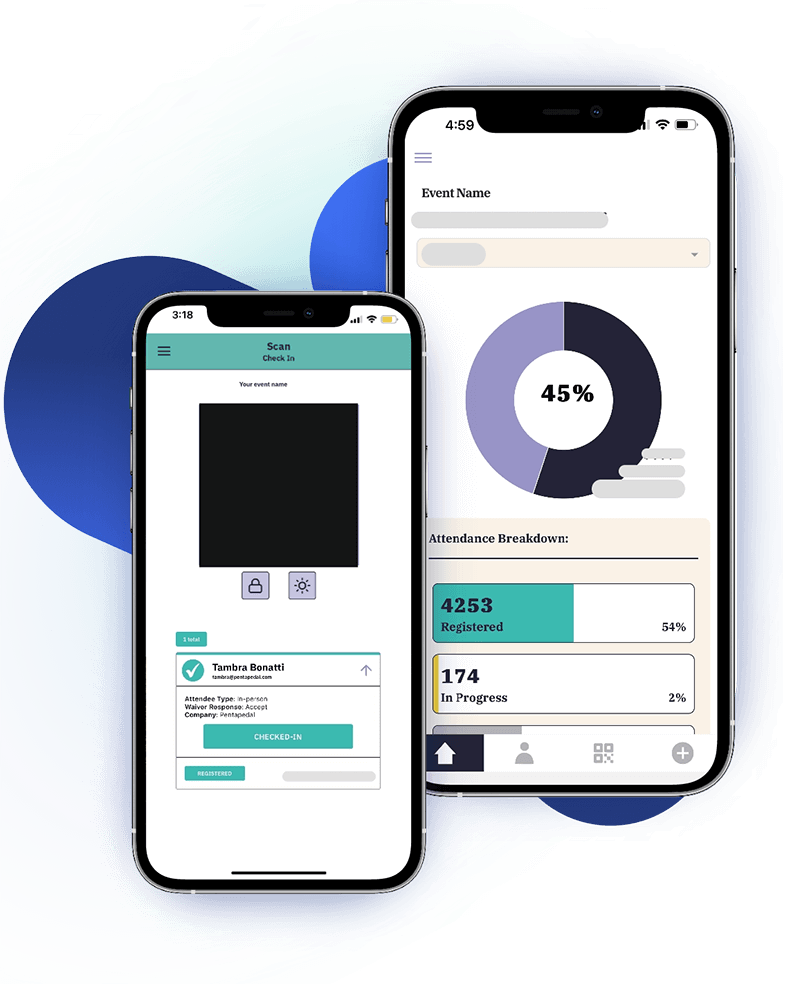
Event Performance
- • Number of check-ins
- • Percentage of check-ins
- • Number of guests added at the door
- • Dynamic data
- • Synced data across multiple users
Survey Results
Gather attendee feedback
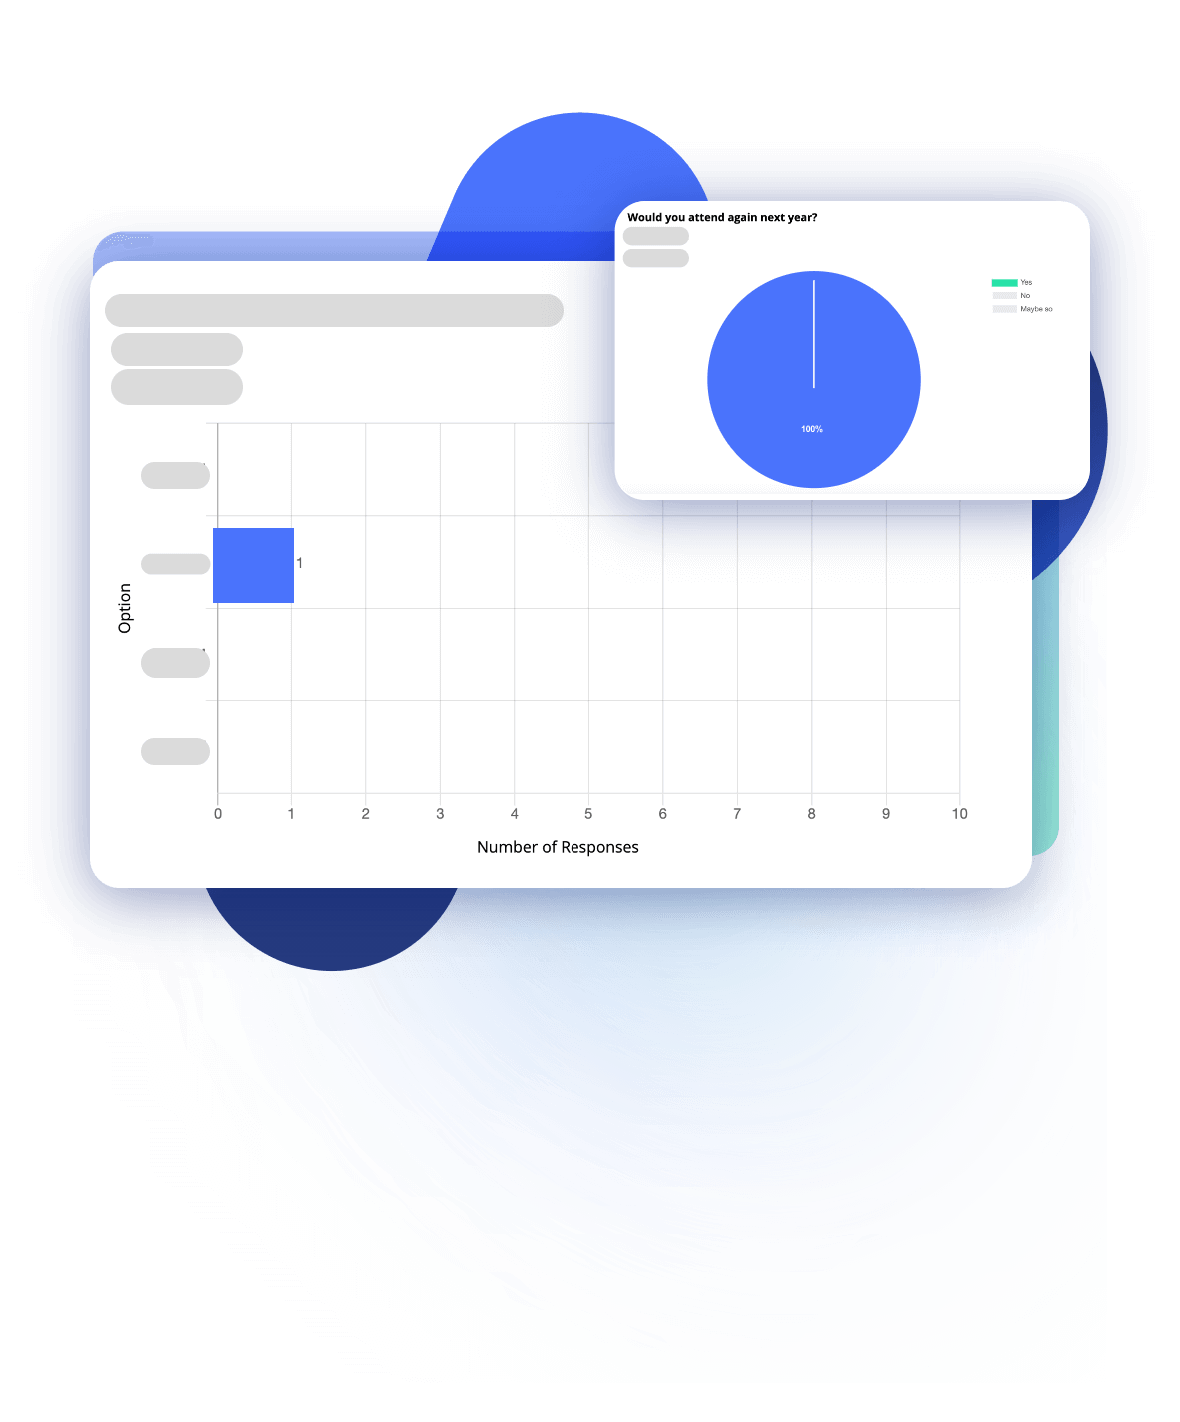
Unlocking Insights
- • Downloadable Reports
- • Actionable Data
- • Data Visualization